PDO
PDO is a quick, easy way to get a bird’s eye view of luck in hockey. It adds on ice save percentage and on ice shooting percentage, both of which are subject to random, luck-induced swings. Theoretically, a team hitting 1.000 is at break even, while a team under 1.000 is having bad luck with their goaltending, shooting, or both, and a team above 1.000 is in the pink.
There are a number of things PDO doesn’t account for (such as talent level, injury, etc), but that’s not a problem unless you are a dullard unable to take in more than one piece of information. PDO works best when compared over time and in conjunction with a number of other factors. And, even then, it’s function is really to provide an indicator, rather than a judgment.
The Conversion Gap
In November of last year, I started tracking what I’m calling “the conversion gap.” That is, the gap between a team’s 5×5 Goals For Percentage (GF%) and their 5×5 Expected Goals For Percentage (xGF%).
GF% is simply the percentage of goals a team scores (i.e., are they outscoring their opponents?).
xGF% is the percentage of goals a team is expected to score based on a model that evaluates the shot location, among other things, of unblocked shots (I’m using Natural Stat Trick’s data here).
The calculation here is pretty simple.
Based on their shots and shot share, a team is expected to score so many goals. The conversion gap measures the gap between that expected goal share and their actual goal share.
This gap tracks with PDO remarkably well and provides a nice supplement to PDO as a catchall, quick reference point for who’s getting lucky and who’s getting jobbed.
2021-22
Here’s a breakdown of last year’s results sorted by their negative conversion gap:

As you can see, no one got jobbed worse than the New Jersey Devils last year, and their 51.45 xGF% helps to explain their seemingly sudden success this year.
Even bad teams can get jobbed. Have a look at Seattle. Last year they were only expected to score a middling 48.36% of the goals at 5×5… but they dramatically underperformed that mark, indicating that they were in fact getting jobbed. Again, their success this year is less surprising in light of their conversion gap.
2022-23
With a much smaller sample size for 2022-23, there’s a lot more volatility here, but the conversion gap continues to track PDO very closely. Look at sad sack Chicago here. Completely hopeless with an xGF% of around 40 and still getting jobbed on a historic scale. Good for her. Fuck those guys.

Now, to a non-trivial degree note how “good” teams generally track with a healthy positive gap and 1+ PDO, which we generally say accounts for their talent level.
But this isn’t always the case. Look at Colorado. A dominant team and among the luck darlings last year. This where’s it all gone?
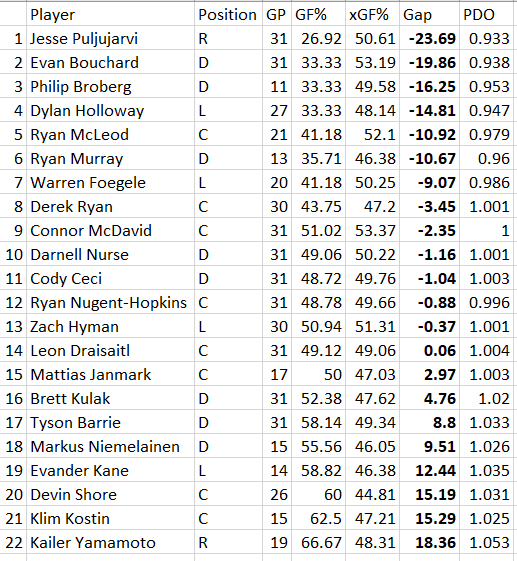
PS. no one in this league gets jobbed harder than Jesse Puljujarvi!
